 Vani Shah
For a growing share of North American households, the weekly grocery run now happens on a screen. Instacart sits near the centre of that change as one of the continent’s largest grocery technology platforms, and every order placed through it records something small but revealing about how a household eats, budgets, and plans its week. Aggregate millions of those orders and the guesswork disappears.
That aggregation is the basis of basket analysis. Rather than asking shoppers what they intend to buy, it examines what they did buy, how frequently, and which items tend to appear together. This report applies that lens to Instacart in 2026, covering its best-selling products, the categories that carry the most volume, and what shopping baskets suggest about consumer purchasing power. The aim throughout is practical: to translate raw grocery data into decisions a brand or retailer can act on.
Why Instacart Basket Analysis Matters in 2026
A basket is a signal, not just a receipt. It indicates what a household treats as non-negotiable, where it will trade down to save money, and which purchases are habitual rather than considered. One basket tells you little. Thousands, analysed together, reveal patterns that surveys rarely capture because they measure behaviour rather than intention.
For a brand, those patterns answer questions that directly affect revenue. Which products are purchased in the same trip, and could therefore be bundled? Which categories hold steady through the year, and which spike around specific holidays? On a platform where thousands of SKUs compete for a shopper’s limited attention, that kind of evidence separates a genuine strategy from a hopeful one.
Instacart’s Scale: The Foundation of the Data
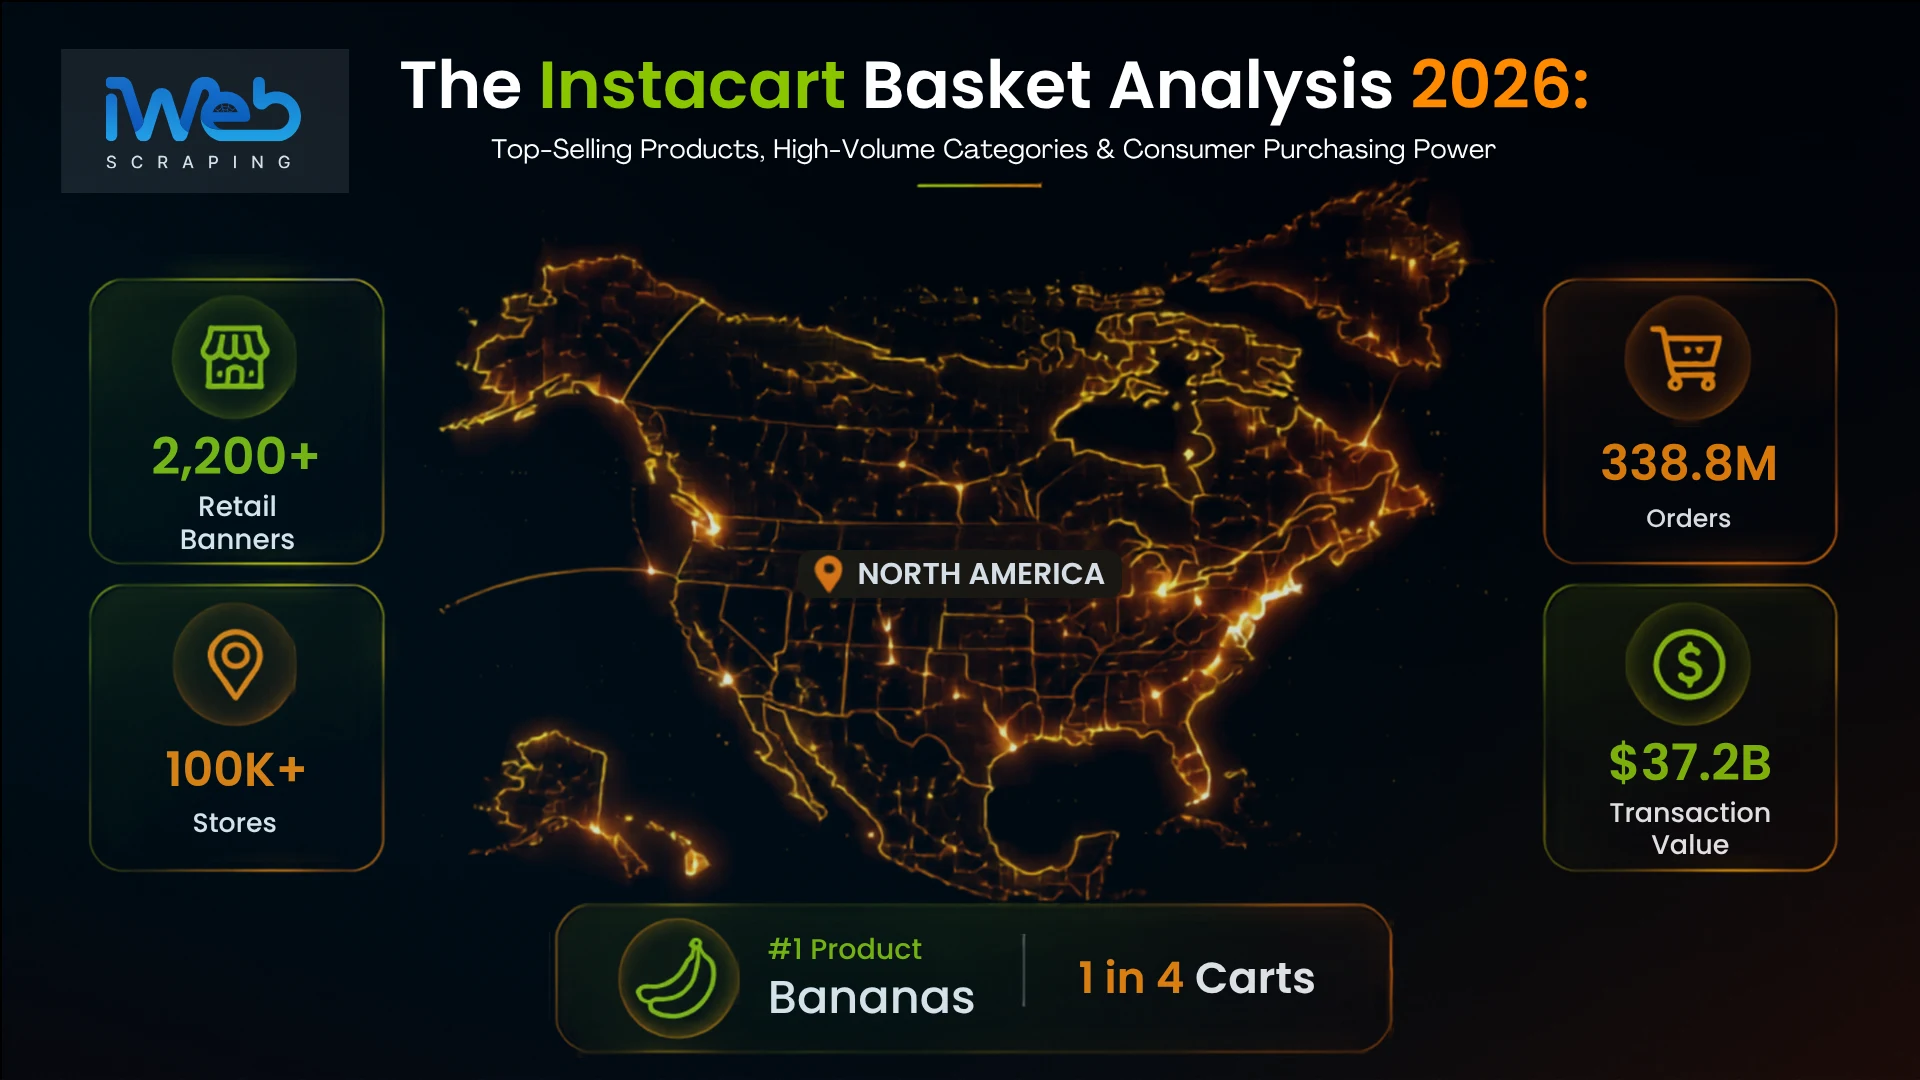
The value of any basket analysis depends on the size and quality of the underlying sample, and Instacart’s is substantial. Its full-year 2025 results reported gross transaction value of $37.2 billion, an 11% increase over the prior year, spread across roughly 338.8 million orders — themselves up 15%. Total revenue came in at $3.7 billion, with adjusted EBITDA rising 23% to $1.087 billion.
The platform also spans an unusually wide retail footprint, partnering with more than 2,200 retail banners across nearly 100,000 stores. Early in 2026 it passed $10 billion in quarterly gross transaction value for the first time. Numbers of this magnitude matter for one reason above all: the sample reflects real money changing hands, not stated preferences that shoppers may never follow through on.
Top-Selling Products on Instacart
The products that dominate Instacart carts are, on the whole, unglamorous. There is no novelty item at the top of the list just the foods households restock without a second thought.
The banana is the clearest case. It has held the position of Instacart’s best-selling grocery item for most of the company’s existence, turning up in roughly one cart out of every four. The company’s own trends team has called it a “trend-proof” purchase, and the description fits: it is cheap, familiar, and bought week after week regardless of what the wider economy is doing.
The rest of the leaderboard follows the same logic. Milk, eggs, bread, and fresh produce anchor the majority of orders. Instacart’s 2025 category data added a few more colourful data points to the picture: vanilla held its place as the country’s default ice cream flavour, accounting for more than a fifth of all ice cream purchases, while pepperoni made up 43% of every frozen pizza item sold. Different products, same underlying preference: the familiar and the convenient tend to win.
Instacart Basket Snapshot: Products & Categories at a Glance
The table below brings together several of the most telling products and categories from Instacart’s basket data, along with what each figure indicates and why it should matter to brands and retailers.
| Product / Category | What the Data Shows | Why It Matters |
| Bananas | Found in roughly 1 in 4 carts; the #1 item for most of Instacart’s history | A trend-proof staple that anchors repeat baskets |
| Vanilla ice cream | Over one-fifth of all ice cream purchases in 2025 | Classic flavours still outsell novelty options |
| Pepperoni frozen pizza | 43% of all frozen pizza items sold in 2025 | Convenience meals drive high-volume repeat buys |
| Fresh produce | Consistently one of the largest categories by sales | Perishables fuel weekly, habit-based ordering |
| Dairy & eggs | Core weekly essentials across most baskets | High reorder frequency stabilises demand |
| Beverages & bulk items | Water, sports drinks, pet food grow via delivery convenience | Bulky goods shift online for doorstep ease |
High-Volume Categories Driving the Basket
Individual best-sellers only tell part of the story. Step back to the category level, and it becomes clear which departments actually carry the platform’s volume.
- Fresh produce: Among the largest and steadiest categories, sustained by the weekly rhythm of habitual buying.
- Dairy and eggs: Present in a large share of baskets and reordered more often than almost any other item.
- Beverages: Water, soft drinks, and sports drinks lend themselves to delivery, since a heavy case is far easier to receive at the door than to carry home.
- Snacks and frozen meals: Grab-and-go bars, chips, and ready meals that speak directly to demand for convenience.
- Household essentials and pet care: The bulky, unexciting necessities — paper goods, detergent, dog food — that shoppers are happy to hand off to a delivery driver.
One theme ties these together: convenience. Shoppers turn to Instacart most readily for the things they buy constantly and the things that are a nuisance to transport. That single observation should inform how a brand ranks its priorities on the platform.
What Baskets Reveal About Consumer Purchasing Power?
What people spend says as much as what they buy. Instacart’s second-quarter 2026 figures put the average order value at about $115, a 4% rise on the year before. That increase points to a real shift in behaviour: shoppers are using the platform for full weekly grocery runs, not just the odd item they forgot.
Yet the same data reveals a careful shopper underneath the larger baskets. Value staples continue to dominate: bananas, own-brand basics, and bulk purchases that bring down the cost per use. Taken together, the pattern describes the 2026 consumer with some precision engaged and loyal to the platform, but deliberate about spending, and unwilling to lose sight of price even while ordering more.
The New Frontier: AI-Driven Grocery Shopping
How baskets get built is itself beginning to change. In December 2025 Instacart introduced the ability to shop and check out directly inside ChatGPT, allowing a customer to move from a meal idea to a completed order without leaving the conversation. Product discovery, in other words, is increasingly mediated by an assistant rather than a manual search bar.
For brands, that development raises the premium on clean, well-structured product data. When an AI assistant is deciding what to recommend, the items with accurate titles, categories, and descriptions hold a distinct advantage over those without. Knowing how baskets behave which products pair, which get reordered becomes part of staying visible in a shopping environment where the first recommendation increasingly comes from software.
How Brands and Retailers Can Use This Data?
Acting on basket insight is more a matter of discipline than of technical sophistication. A handful of moves tend to deliver most of the benefit.
- Bundle with intent: Pair items that already travel together chips with dip, pasta with sauce to lift the average order value rather than leaving it to chance.
- Anticipate the calendar: Holiday and event spikes, from Easter candy to summer grilling supplies, are predictable enough to plan promotions around well in advance.
- Protect the staples: High-frequency essentials are what bring shoppers back, so keeping them in stock and easy to find should take priority over almost everything else.
- Write for search and for AI: Clean product titles, accurate categories, and clear descriptions help human shoppers and automated assistants alike surface your products.
Each of these depends on something unglamorous but essential: reliable, well-formatted data on products, prices, and availability. That is the raw material web scraping and structured data collection are built to supply.
Quick Facts: Instacart in 2025–2026
- Gross transaction value reached $37.2 billion in 2025, an 11% year-over-year increase.
- The platform handled 338.8 million orders in 2025, up 15% on the prior year.
- Bananas remain the single best-selling item, appearing in roughly 1 in 4 carts.
- Vanilla accounted for over one-fifth of ice cream purchases in 2025; pepperoni made up 43% of frozen pizza items sold.
- Instacart partners with more than 2,200 retail banners across nearly 100,000 stores.
- In December 2025, the company enabled shopping and checkout directly inside ChatGPT.
Conclusion
The story the data tells is a coherent one. In 2026, more households than ever are shopping for groceries online, filling larger baskets, and still building those baskets around dependable staples bananas, milk, eggs, fresh produce. Volume concentrates in the categories that reward convenience, and average order values are climbing even as shoppers remain measured about what they spend.
For brands and retailers, the implication is hard to miss. The businesses that read these patterns correctly, and support that reading with accurate, structured data, are the ones positioned to win visibility whether the shelf in question sits inside an app or inside an AI assistant. Basket analysis has moved from a useful supplement to a foundation of serious grocery strategy.

 iWeb Scraping
Read Time: 10 min
iWeb Scraping
Read Time: 10 min