

Web Scraping in Power BI – How to Scrape Data from a Website in Power BI?

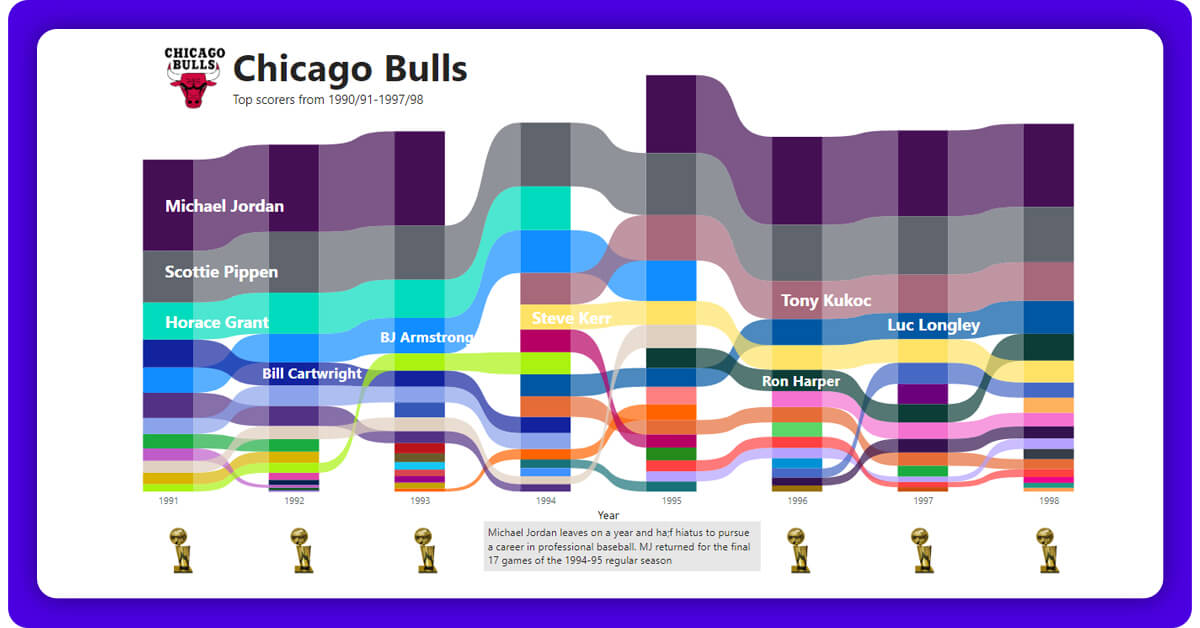
Extracting data from a website in Power BI is very easy. In this blog, we will show you how easy it is to extract data from website in Power BI using Bulls Dynasty dashboard (given below) like an example.
Phase 1. Connect to Data
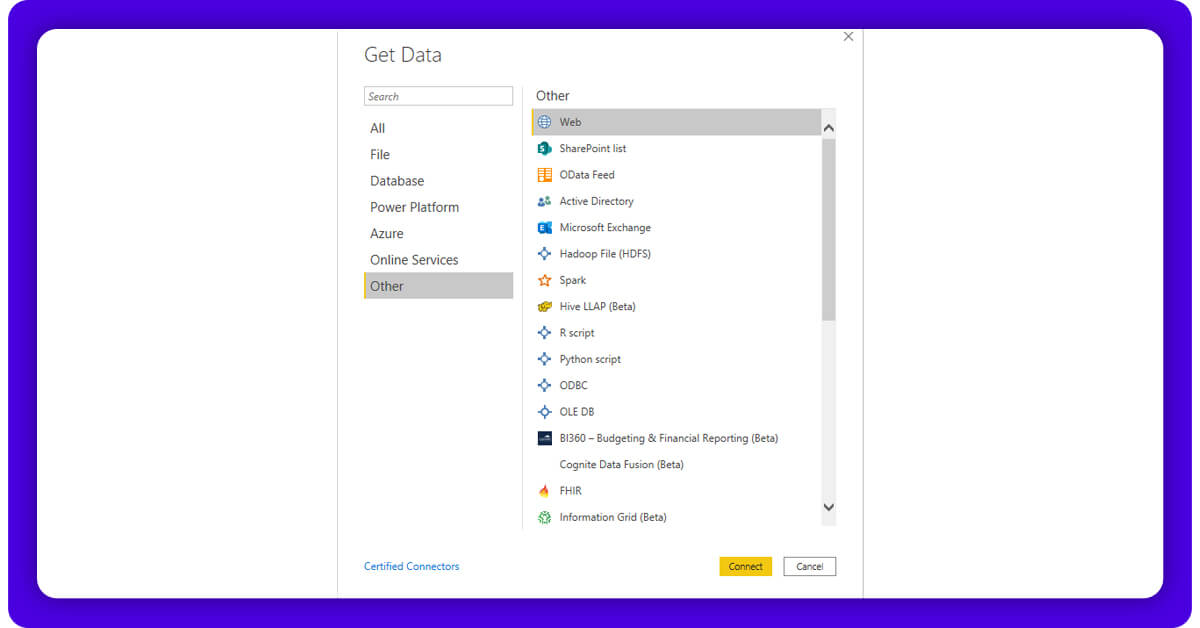
To begin, just open Power BI as well as click on the option Transform Data and open the option ‘Power Query Editor’. Then click on New Source. It will provide us different options for connecting by default, however you can click on ‘More’ option given at bottom of this list to observe an extended listing of options.
In the given example we would be scraping data directly from the website basketball-reference.com. To do that, we require to choose Web option underneath ‘Other’ option. Whenever you hover on that option, it tells “Import data from the Web page” as it sounds like what we wish to perform! Click Connect.
When you’ve clicked on Connect option, you’ll get a screen below providing two alternatives, Basic and Advanced. Today, we would be utilizing the Basic alternative. It looks like it needs to be stiffer than that, however, just input a URL from a website that you want to find data from as well as paste that in a bar as well as click Ok. Here, we will get data for 1994-95 Chicago Bulls team using the given below URL:
https://www.basketball-reference.com/teams/CHI/1995.html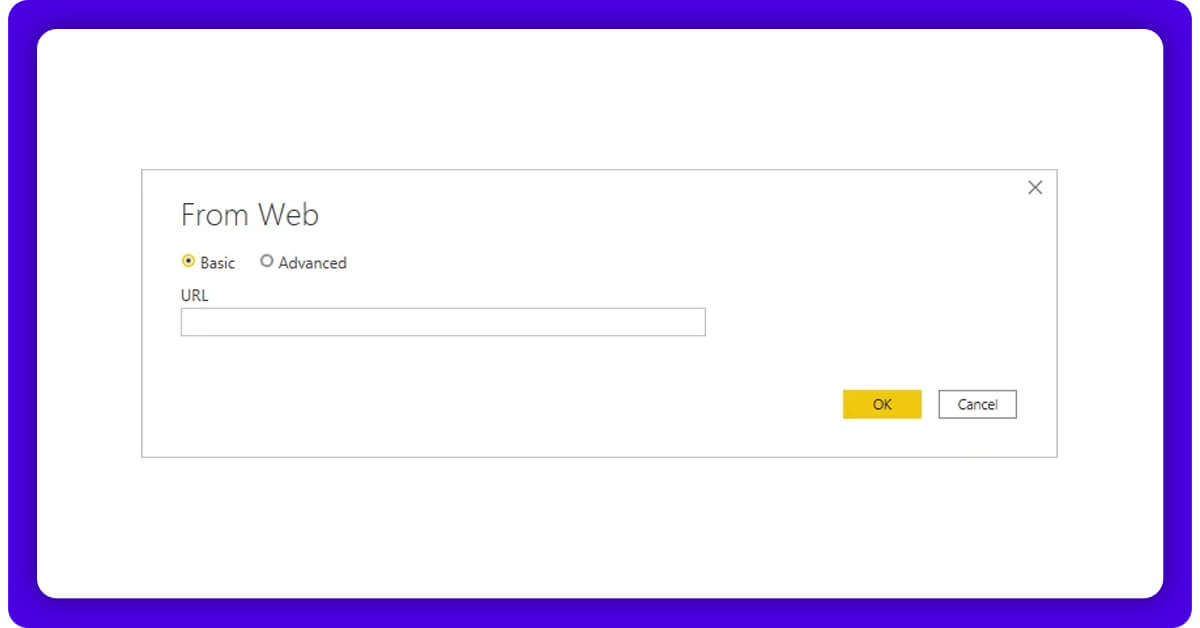
Phase 2. Import Data
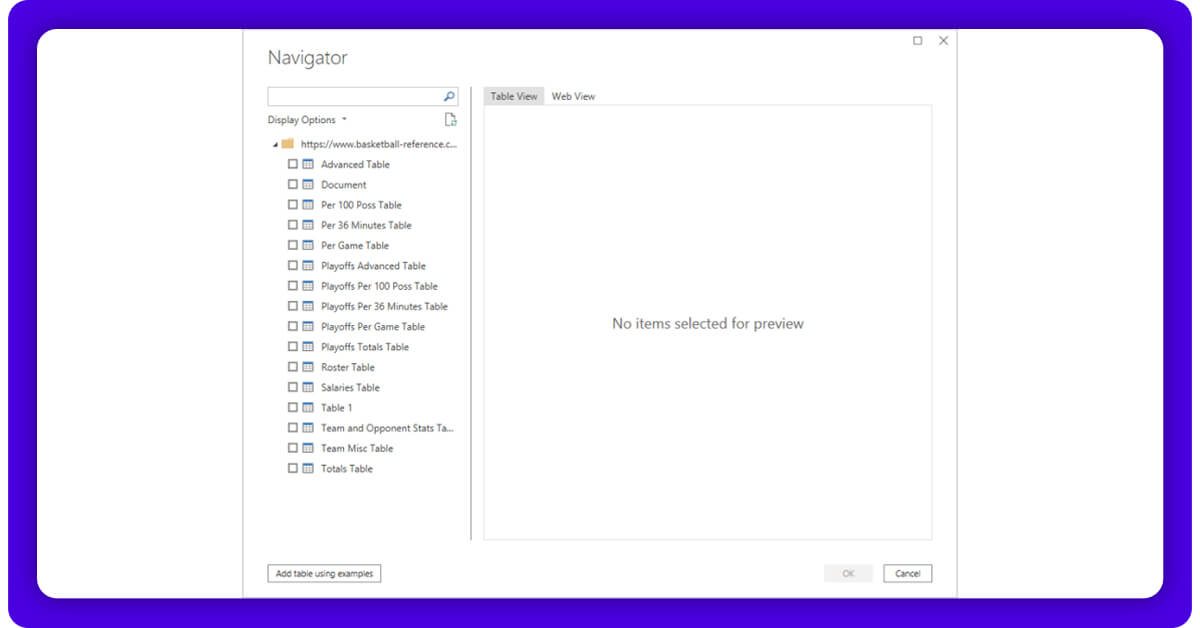
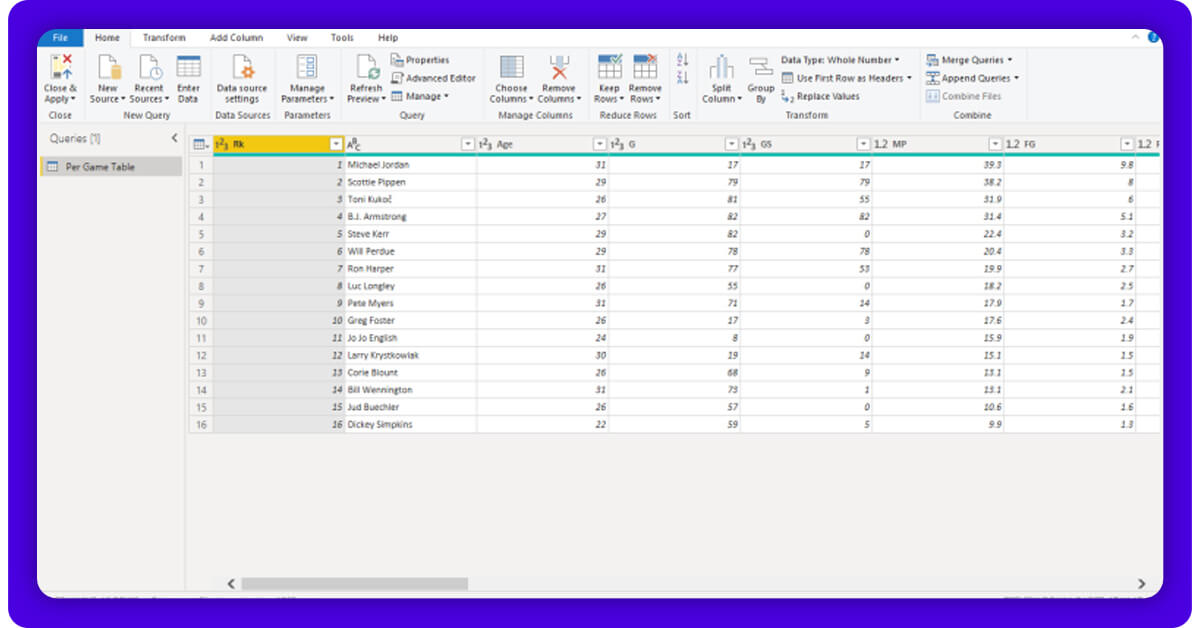
While building the R script for doing a similar job, it’s very important to understand which tables you refer in HTML, however Power BI separates these tables. In case, you see here, Power BI returns diverse sections of a web page helping us to import data, which we are interested with. For the use case, we want the Per Game Table, therefore, we will click on the box as well as press Ok.
Phase 3. Transform Data
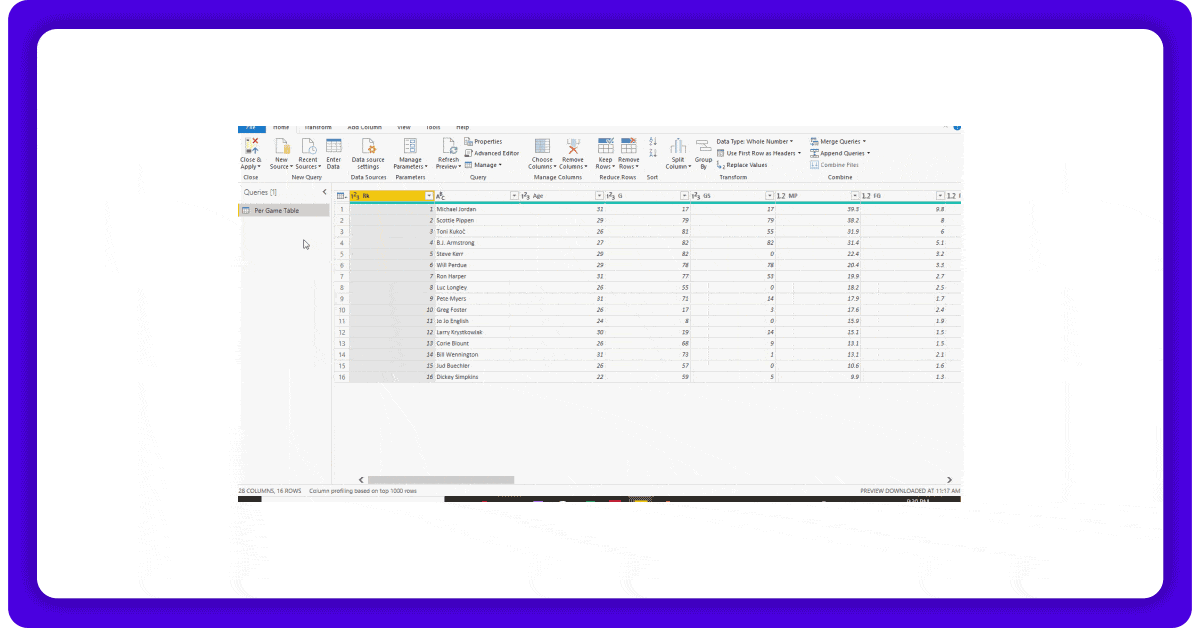
Now as our data has been transported in Power Query Editor, we need to do certain basic manipulations to ensure that the data model is set appropriately.
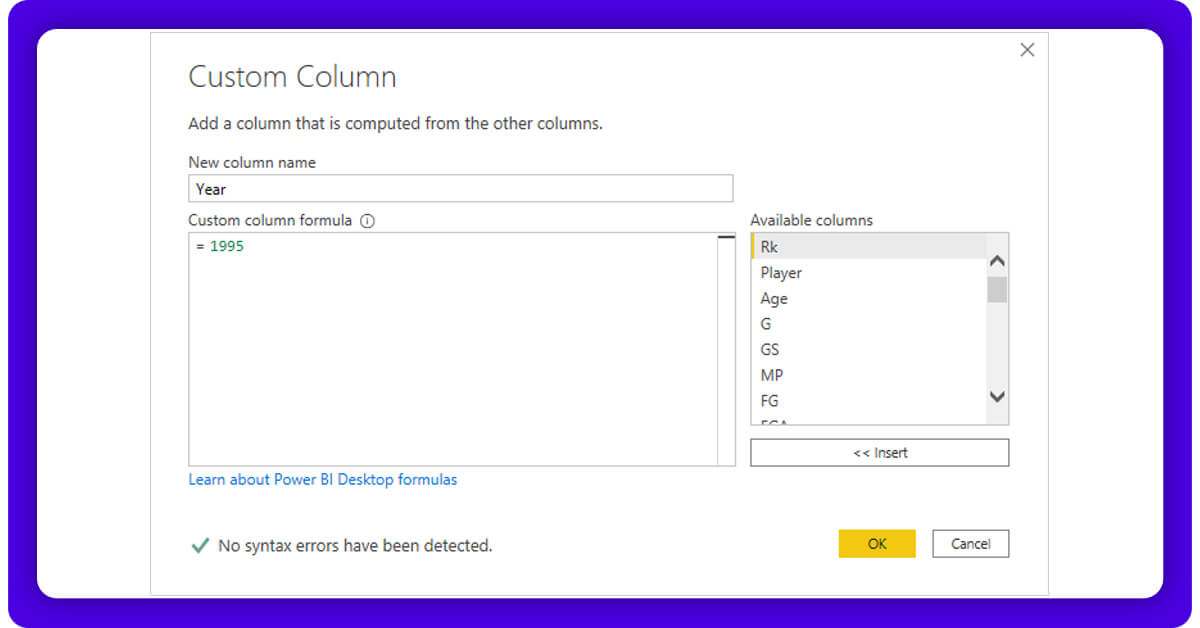
Initially, we need to double click second column’s header that is presently blank as well as rename that as Player. We then wish to add one column to specify what seasons these stats are used for. Choose ‘Add Column’ strip at top as well as choose Custom Column. Then, name the column Year as well as make value 1995. Then, click Ok.
After that, go to left-hand side as well as rename sheet according to the year as well as add one more query for 1996 season. The procedure should be a similar procedure like importing 1995 excluding one character difference in a URL. Here, we have created 8 queries having 1 for every season we wanted to look at.
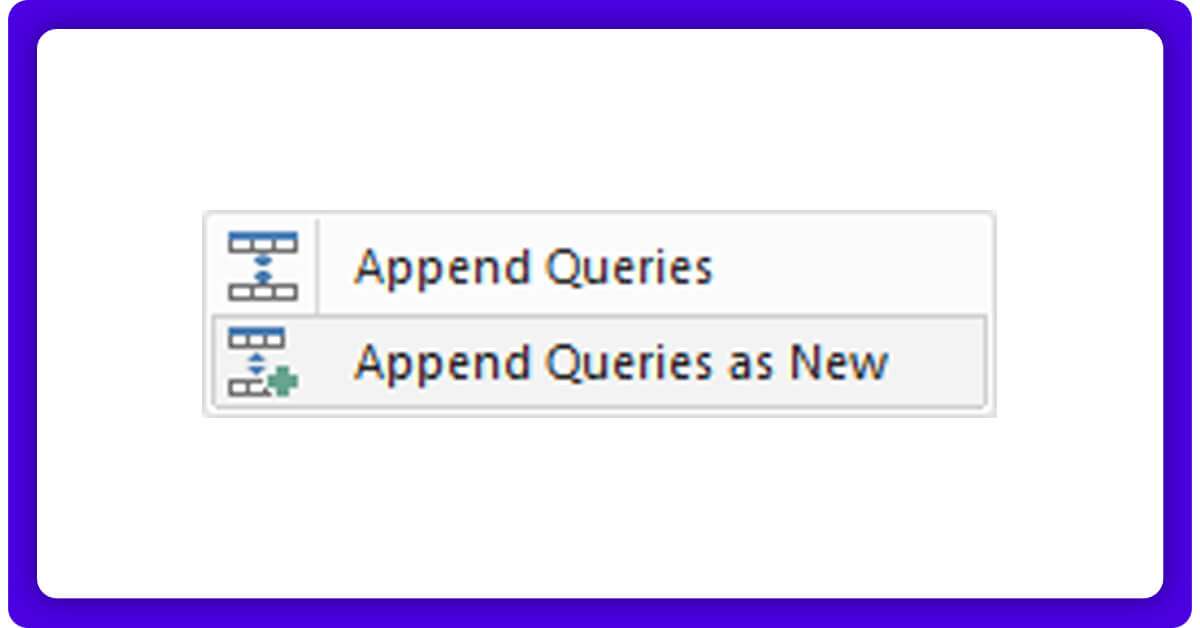
When you have all the seasons, which you wish to include within data analysis, then you would require a way to combine all the data to make final data sets. Fortunately, Power BI provides us an easy way of do it as well! Show up all the required queries as well as go on top right hand side of Home ribbon as well as click on drop down called Append Queries. As we required to keep all the original queries, we have clicked on Append Queries like New. It will make a novel query table on left-hand side.
When it gets done, just click on ‘Close’ option as well as Apply in top left side to visualize the data!
Phase 4. Visualize Data
It was the easiest as well as most amusing part of this procedure. We chose Ribbon chart in visualizations pane for representing this data because we felt that we needed to show an ebb as well as flow of definite measures. We have placed a Year column, which we have made in an Axis field, a Player field in Legend, as well as our anticipated measure like points for every game shown here, in Value field.
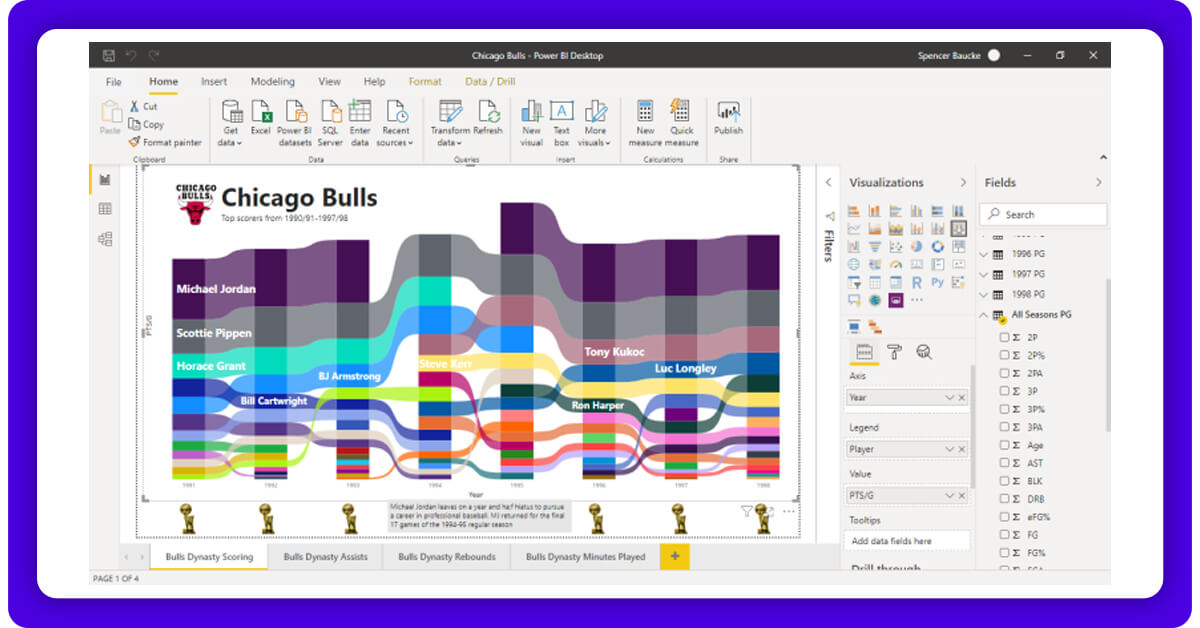
With text boxes having 100% transparent backgrounds as well as manually positioning them, we have created different data labels for the Ribbon chart. These trophy icons are transparent images positioned manually.
That’s it!
If you have any comments, questions, or queries, or you want web scraping in Power BI services then contact iWeb Scraping or ask for a free quote!